Command Line Interface
In addition to the Eclipse plug-in, we have developed a tool that can be executed from the command line. Its goal is to allow users to perform some common tasks related to CARMA models through a simple, lightweight interface that is also amenable to scripting, thus providing programmatic access to some of the CARMA tools.
The command line tool is available as a self-executing Java package and does not require an installation of the Eclipse environment or any additional libraries. It can therefore be used on any machine where Java 1.8 is installed and on any major operating system.
The main task of the command line tool is to serve as an interface to the CARMA simulation engine. This is useful for running jobs over server machines or for scheduling consecutive simulations, avoiding the need to initiate and oversee each individual task through the graphical interface.
The user provides a file describing one or more experiments to be performed, specifying parameters such as final time of the simulation and the measures to be recorded. The format of this description is the same as the one produced by the Eclipse plug-in, so that files generated through the GUI can be reused in the CLI. If desired, the user can override certain parameters of the experiment file, such as the number of replications to be executed, and can also set the seed of the random number generator used in the simulations. These features allow for easier programmatic manipulation and replication of experiments.
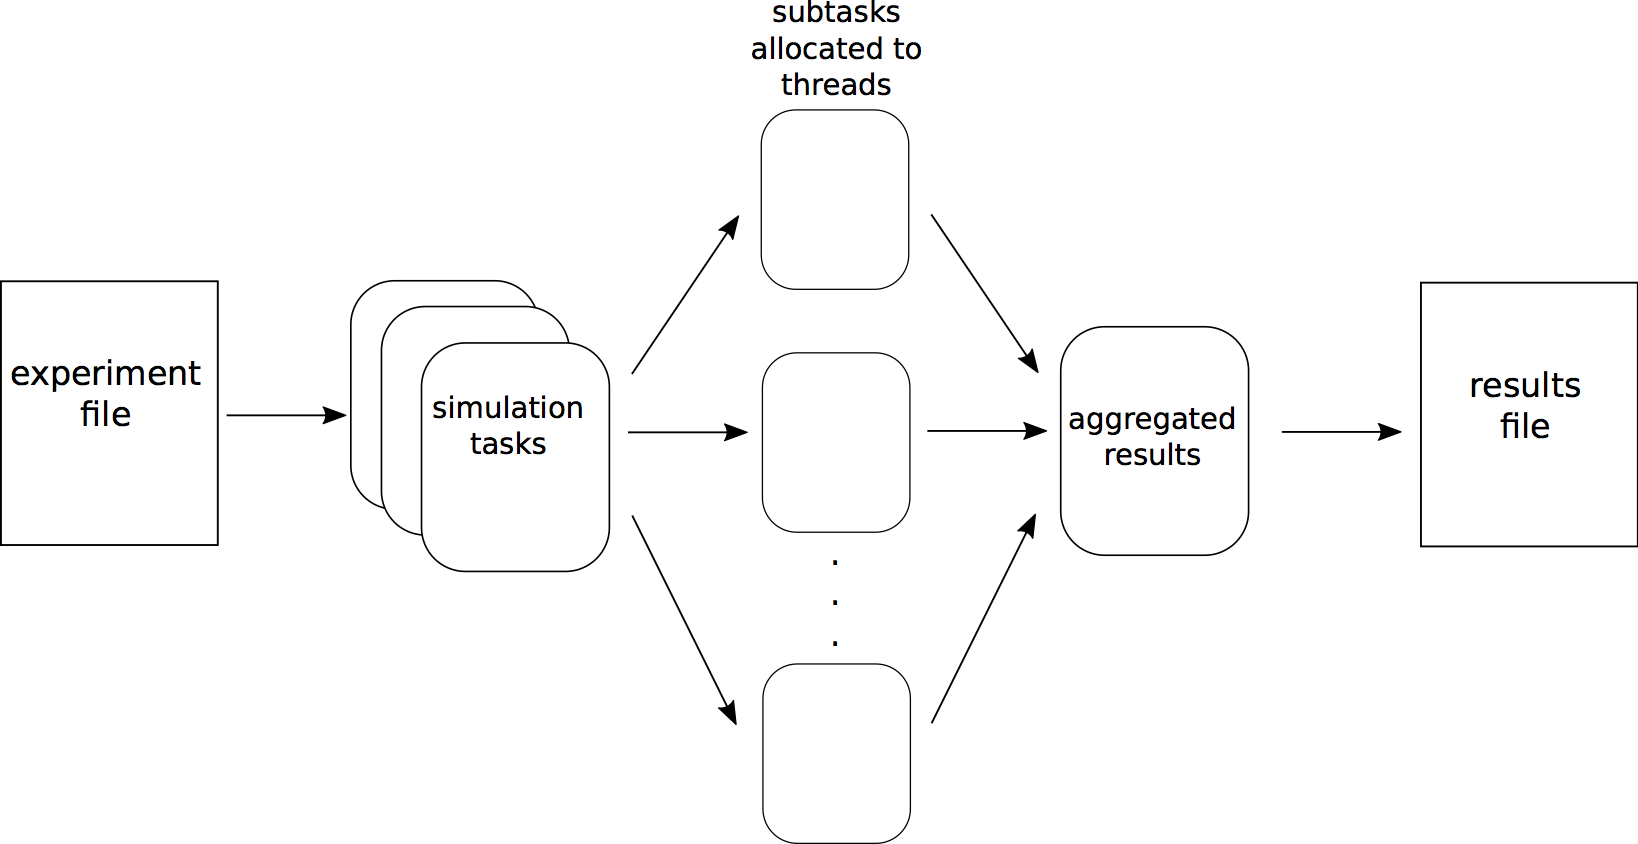
To take advantage of the multi-core architectures found in many computing servers and clusters, the tool allows the user to specify an optional parallelization parameter N. If so provided, this will automatically split each experiment into $N$ subtasks and attempt to execute them in parallel, using different processing threads or cores as determined by the operating system used. When all the subtasks are completed, the tool collects each set of results and aggregates them to produce the overall statistics. A diagram of the process is:
Once all simulations are finished (whether executed sequentially or in parallel), the results are stored in CSV format, with one file for each measure requested, in a location optionally specified by the user. For each measure, the file contains the mean and variance of its value at the different time points sampled. To help with the organisation of experimental results and to facilitate potential replications of the experiment, several important aspects of the simulation are recorded. Specifically, in addition to the results, the following files are created to provide metadata for the process:
- a copy of the model used for the simulation;
- a copy of the segment of the experiments file corresponding to the particular experiment (reflecting any overriden parameters), which can then be reused as input to the tool;
- a text file containing a human-readable summary of the experiment, including the model, aspects of the simulation (such as the stopping time), any user-specified parameters, the time required for the experiment, and the date and time of execution.
Furthermore, a script file for the gnuplot or MATLAB software is created, allowing the user to easily produce visualisations from the saved results if desired. The script can be run as-is or further edited by the user as required.
While simulation is the primary goal of the command line interface, it also offers other functionality. A second option is to perform more elaborate statistical analysis through MultiVeStA. This is done by providing a file defining the quantities of interest in the MultiQuaTEx syntax recognised by the model-checker. The evaluation results are stored in a text file, and a plot is displayed and also stored in an image file. The tool can also be used to present a summary of the model to the user, as well as to produce a LaTeX file with information about the model.